
철솜_STUDY
파이썬 머신러닝 완벽 가이드 _ CH.1_(3) 본문
CH.1.5 _ Pandas
pandas는 파이썬에서 데이터 처리를 위해 존재하는 라이브러리이며, NumPy를 기반으로 작성됐다.
pandas의 핵심 객체는 DataFrame으로 2차원 데이터를 담는 데이터 구조체인데,
이를 이해하기 위해서는 Index와 Series라는 중요 객체를 이해해야 한다.
DataFrame과 Sereis 모두 Index를 key값으로 갖고 있으며, Series는 col이 하나인 데이터 구조체이고 DataFrame은 col이 n개인 데이터 구조체이다.즉 몇 차원 데이터인지에 따라 구분하면 된다고 볼 수 있다.
Series는 index와 values 구조를 갖고, DataFrame은 index, columns, values 구조를 갖는다.
index가 row와 같은 기능을 한다고 볼 수 있다.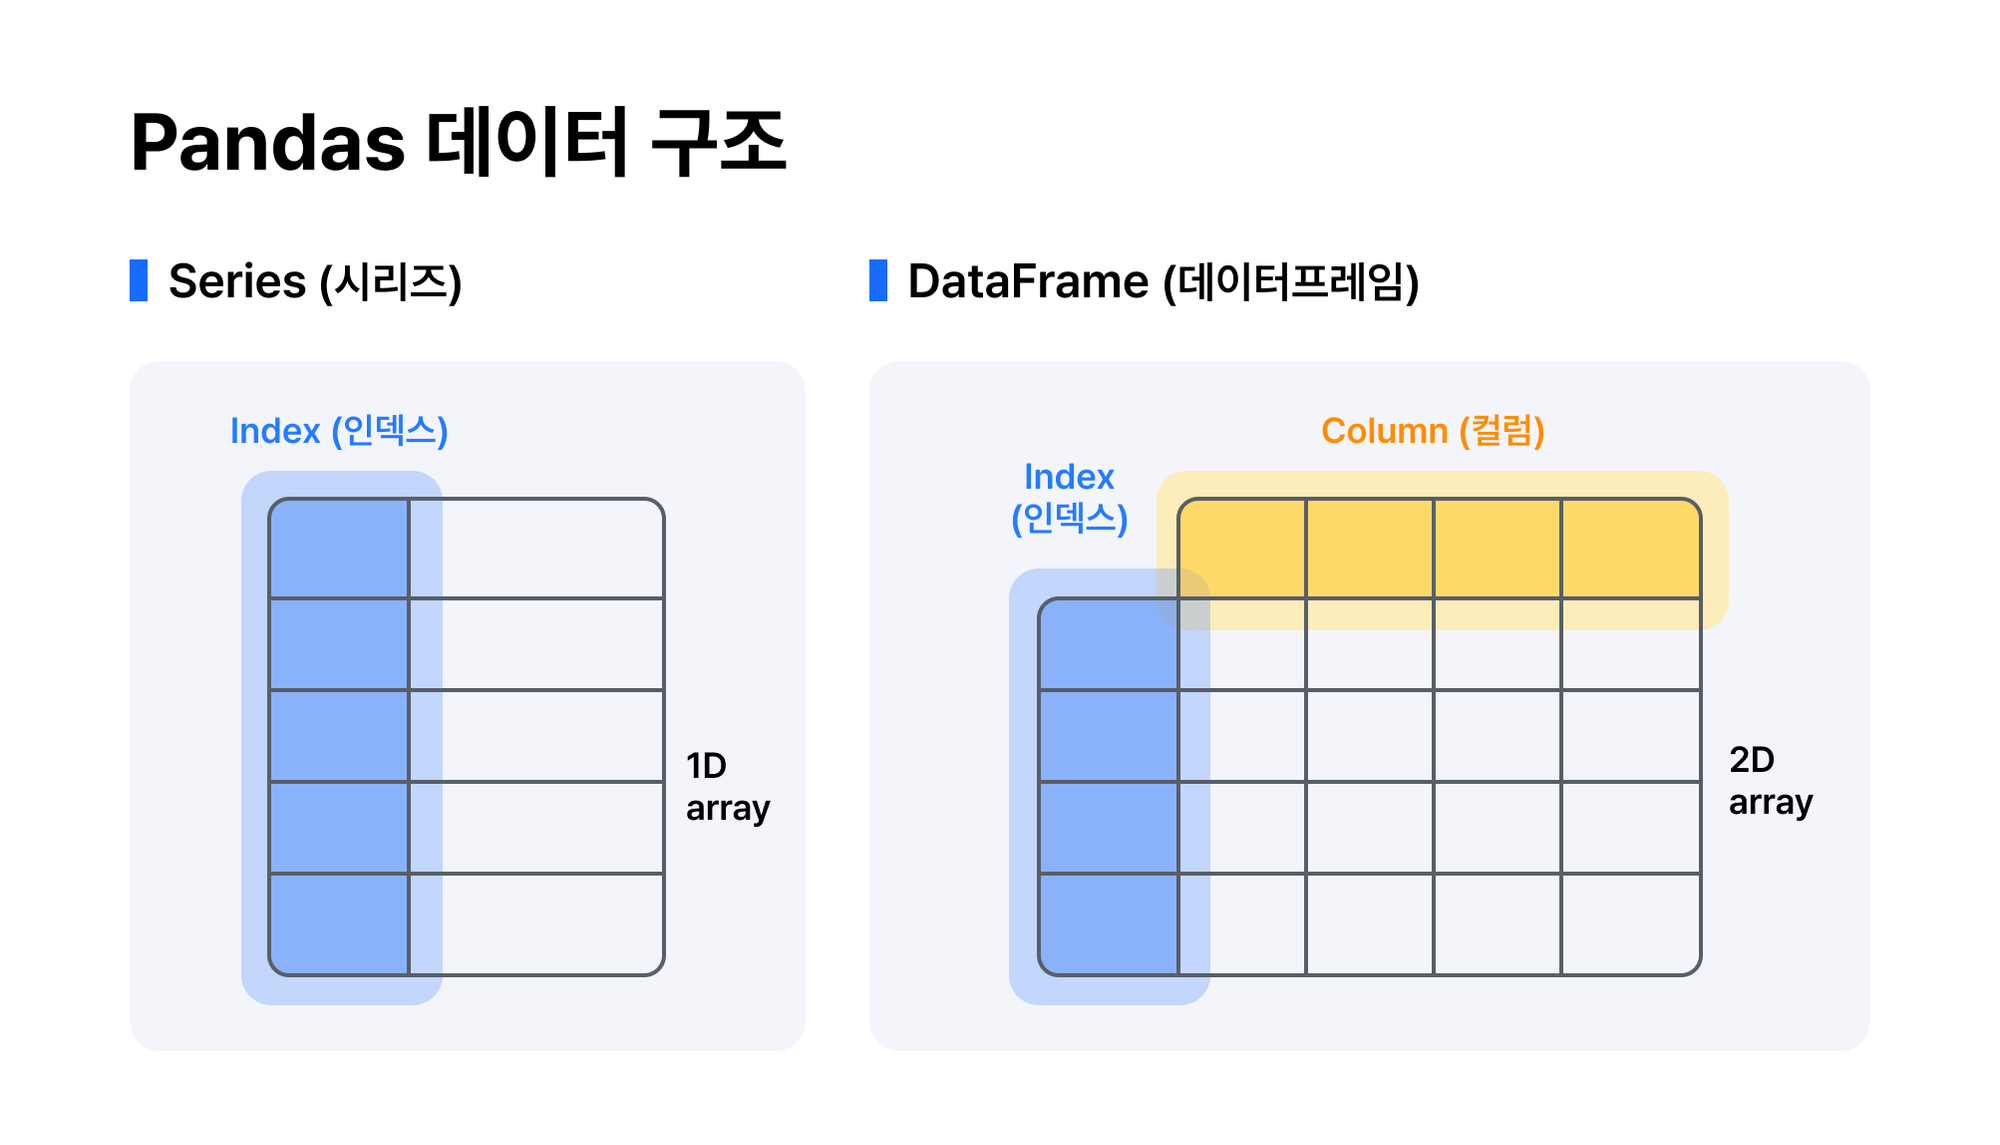
pandas는 다양한 포맷의 파일을 DataFrame으로 로딩할 수 있는 API를 제공하는데,
대표적으로 read_csv() read_table() read_fwf()이 있다.
앞의 2개는 필드 구분 문자(Delimeter)가 무엇인지로 구별하게 되는데 각각 ',' '\t' 이다.
read_fwf() 는 고정 길이 기반으 칼럼 포맷을 DataFrame으로 로딩하는 API이다.
#옵션 종류
- filepath : 로드하려는 데이터 파일의 경로명 * \는 1개가 아닌 2개를 써줘야 /로 인식한다.
- sep = : csv 파일도 '\t'를 기준으로 읽도록 조정 가능
0. 기본적인 파이썬 문법
- DataFrame.head(n) : DataFrame의 전자 n개의 데이터를 보여주는 메서드
- DataFrame.shape : DataFrame의 구조, 즉 row * col 을 보여주는 메서드
- DataFrame.info() : DataFrame의 총 데이터 건수, 데이터 타입, NULL 건수를 보여주는 메서드
- DataFrame.describe() : DataFrame의 칼럼별 n-percentile 분포도, 평균, 최대, 최소 등을 보여주는 메서드
- DataFrame[Column].value_counts() : DataFrame의 특정 칼럼의 유형과 건수를 확인하는 메서드
*숫자형만 조사
Index는 순차적인 숫자로 할당되기도 하지만, 밑의 예시와 같은 titanic data의 Pclass의 경우 1, 2, 3이라는 좌석 클래스가 유의미했기 때문에 index로 할당된 모습을 볼 수 있다.
value_counts()는 NULL 값을 무시하고 결과값을 내놓는다.
만약 NULL 값을 포함해 개별 데이터의 건수를 계산하고 싶다면 dropna 옵션을 이용할 수 있다.
import pandas as pd

titanic_df = pd.read_csv("C:\\Users\\rud92\\Downloads\\train.csv")
titanic_df.head(3)

value_counts = titanic_df['Pclass'].value_counts()
print(value_counts)
print(type(value_counts))

#결과
Pclass
3    491
1    216
2    184
Name: count, dtype: int64
<class 'pandas.core.series.Series'>


print("titanic_df 데이터 건수: ", titanic_df.shape[0])
print("기본 설정인 dropna=TRUE로 value_counts()")

print(titanic_df['Embarked'].value_counts())
print(titanic_df['Embarked'].value_counts(dropna=False))

#결과
titanic_df 데이터 건수:  891
기본 설정인 dropna=TRUE로 value_counts()
Embarked
S    644
C    168
Q     77
Name: count, dtype: int64
Embarked
S      644
C      168
Q       77
NaN      2
Name: count, dtype: int64
1. DF와 다른 데이터 객체의 상호 변환
#NumPy ndarray / list / Dictionary -------> DataFrame
DataFrame은 리스트와 ndarray와 달리 칼럼명을 갖는다.
그러므로 pd.DataFrame(변환 대상 객체, ) 를 통해 변환할 때 'columns= ' 옵션을 통해 칼럼명을 지정해 줘야 하며, default 값 또한 존재한다.
Dictionary의 경우 이미 key와 values가 존재하기 때문에
key 값이 문자열 Data type인 column이 되고, values의 경우 list 혹은 ndarray 형태로 들어가게 된다.
import numpy as np
import pandas as pd

col_name1 = ['col1']
list1 = [1, 2, 3]                                        #리스트 생성
array1 = np.array(list1)                                 #ndarray 생성
print('array1 shape : ', array1.shape)

df_list1 = pd.DataFrame(list1, columns=col_name1)        #list를 DF로
print(df_list1)

df_array1 = pd.DataFrame(array1, columns=col_name1)      #ndarray를 DF로
print(df_array1)


#결과
array1 shape :  (3,)
   col1
0     1
1     2
2     3
   col1
0     1
1     2
2     3

#=======================================================================

col_name2 = ['col1', 'col2', 'col3']

list2 = [[1, 2, 3], [11, 12, 13]]
array2 = np.array(list2)

print(list2,'\n')
print(array2,'\n')

df_list1 = pd.DataFrame(list2, columns=col_name2)
print('2차원 리스트로 만든 DataFrame : \n', df_list1)
df_list2 = pd.DataFrame(array2, columns=col_name2)
print('2차원 ndarray로 만든 DataFrame : \n', df_list2)


#결과
[[1, 2, 3], [11, 12, 13]]

[[ 1  2  3]
 [11 12 13]]

2차원 리스트로 만든 DataFrame :
    col1  col2  col3
0     1     2     3
1    11    12    13
2차원 ndarray로 만든 DataFrame :
    col1  col2  col3
0     1     2     3
1    11    12    13


#===================================================================
dict = {'col1':[1, 11], 'col2':[2, 22], 'col3':[3,33]}
df_dict = pd.DataFrame(dict)
print('딕셔너리로 만든 DataFrame: \n', df_dict)

print("df_dict.values 타입 : ", type(df_dict.values), 'df_dict.values shape : ', (df_dict.values).shape)


#결과
딕셔너리로 만든 DataFrame:
    col1  col2  col3
0     1     2     3
1    11    22    33
df_dict.values 타입 :  <class 'numpy.ndarray'> df_dict.values shape :  (2, 3)
# DataFrame -------> NumPy ndarray / list / Dictionary
많은 머신러닝 패키지가 기본 데이터 형으로 ndarray를 사용하기 때문에, DF를 ndarray로 변환해야 하는 경우가 생긴다.
DataFrame 객체의 values 만을 뽑아내서 쉽게 변환할 수 있다.
array3 = df_dict.values
print('df_dice.values 타입 : ', type(array3), 'df_dict.values shape : ', array3.shape)
print(array3)

#결과
array3 = df_dict.values
print('df_dice.values 타입 : ', type(array3), 'df_dict.values shape : ', array3.shape)
print(array3)
df_dice.values 타입 :  <class 'numpy.ndarray'> df_dict.values shape :  (2, 3)
[[ 1  2  3]
 [11 22 33]]
list에는 column이 없기 때문에 DataFrame 속 values만을 tolist() 메서드를 이용해 변환하게 된다.Dictionary의 경우 DataFrame과 형태가 유사하기 때문에 to_dict() 메서드를 이용해 변환한다.
*to_dict() 속 'list' _ DataFrame 속 열을 list로 반환해서 dictionary의 key 값으로 넣는다.
list3 = df_dict.values.tolist()
print('df_dict.values.tolist() 타입 : ', type(list3))
print(list3)

dict3 = df_dict.to_dict('list')
print('\n df_dict.to_list() 타입 : ', type(dict3))
print(dict3)

dict4 = df_dict.to_dict()
print(dict4)

#결과
df_dict.values.tolist() 타입 :  <class 'list'>
[[1, 2, 3], [11, 22, 33]]

 df_dict.to_list() 타입 :  <class 'dict'>
{'col1': [1, 11], 'col2': [2, 22], 'col3': [3, 33]}
{'col1': {0: 1, 1: 11}, 'col2': {0: 2, 1: 22}, 'col3': {0: 3, 1: 33}}
2. DF의 칼럼 데이터 세트 생성 & 수정
DataFrame에 새로운 칼럼을 추가하는 방법에 관한 것으로, [ ] 연산자를 이용해 쉽게 추가 가능하다.
titanic_df['Age_0'] = 0
위의 명령어를 시행하면 'Age_0'이라는 이름을 갖고, 모든 원소가 0인 Series가 titanic_df 라는 DataFrame에 추가된다.
이 [ ]라는 연산자를 이용한 칼럼 간 계산 또한 가능하다.
titanic_df['Age_10'] = titanic_df['Age_0']*10
titanic_df['Family No'] = titanic_df['SibSp'] + titanic_df['Parch'] +1
3. DF의 데이터 삭제
DataFrame에서 데이터의 삭제는 drop() 메서드를 이용한다.
DataFrame.drop(labels = None, axis = 0, index=None, columns = None, level = None, inplace = False, errors = 'raise')
* 주요 parameter : labels / axis / inplace
axis는 특정 칼럼(1) 혹은 행(0)을 드롭하기를 결정하는 parameter이다.
*책에서는 주로 column을 드랍하는 경우가 많아 일반적으로 axis=1 로 설정한다.
titanic_drop_df = titanic_df.drop('Age_0', axis=1)
inplace는 np.sort() / ndarray.sort() 를 생각하면 쉬운 parameter로 drop 결과 저장 DF를 선택한다고 볼 수 있다.
inplace=FALSE 로 설정하면 원본을 유지하면서 명령을 수행한 새로운 DF를 반환한다.
inplace=TRUE로 설정하면 원본에서 명령을 수행하고 새로운 DF를 반환하지 않는다.
drop_result = titanic_df.drop(['Age_0', 'Age_10', 'Family No'], axis=1, inplace=True)
4. Index 객체
pandas의 Index 객체는 DataFrame, Series의 레코드를 고유하게 식별하는 객체이다.
DataFrame.index / Series.index 라는 속성을 통해 Index 객체를 추출할 수 있다.
이렇게 추출한 Index 객체는 1차원 ndarray라고 볼 수 있고, index.values 속성으로 값을 확인할 수 있다.
- 이렇게 추출한 Index 객체의 값을 함부로 변경하는 작업은 수행할 수 없다.
- sum( ) 연산을 수행한다고 하더라고 index의 값이 더해지는 일은 발생하지 않는다.
- reset_index( ) : 새롭게 인덱스를 연속 숫자 형으로 할당하며, 기존 인덱스는 index라는 칼럼명으로 추가된다.
*reset_index( ) 의 경우 인덱스가 연속된 int 숫자형 데이터가 아닐 경우 연속 int 숫자형 인덱스로 만들 경우 사용한다.
만약 drop=True 라는 옵션을 설정하면 기존 index가 새로운 칼럼으로 들어가지 않고 drop(삭제)된다.
4. 데이터 셀렉션 및 필터링
NumPy는 [ ] 를 이용한 단일 값 추출, 슬라이싱, 팬시 인덱싱, 불린 인덱싱을 통해 데이터를 추출했다.
Pandas는 iloc[ ] & loc[ ] 연산자를 통해 작업을 수행한다.
DataFrame 의 [ ] 는 칼럼명 문자, 또는 인덱스로 변환 가능한 표현식이 들어갈 수 있다.
즉, 칼럼과 관련된 내용 혹은 인덱스 관련 내용만이 [ ]에 들어갈 수 있다는 것이다.
단일한 숫자는 들어갈 수 없으므로 특정한 칸을 선택하는 방법인 iloc과 loc을 제공한다.
print(titanic_df['Pclass'].head(3), '\n')
print(titanic_df[['Survived', 'Pclass']].head(3), '\n')

print(titanic_df[0:2])   #이런 식의 사용은 지양하는 것이 좋다.

print(titanic_df[titanic_df['Pclass]==3].head(3))
#iloc[ ] 연산자
row나 column을 지정하여 선택할 수 있는 방법 중 하나이다. _ 위치 기반
* : 이라는 연산자를 활용하며, 숫자를 이용해 위치를 지정한다. start와 stop+1 이라고 보면 이해가 쉬울 것.
data = {'Name':['Chulmin', 'Eunkyung', 'JiYeon', 'SoEun'], 'Year':[2011, 2016, 2015, 2015], 'Gender':['M', 'F', 'F', 'F']}

data_df = pd.DataFrame(data, index = ['one', 'two', 'three', 'four'])
data_df


data_df.iloc[0,0]

#결과
'Chulmin'

data_df.iloc[1,0]
data_df.iloc[2,1]
data_df.iloc[0:2, [0,1]]
data_df.iloc[0:2, 0:3]
data_df.iloc[:]
data_df.iloc[:, :]
data_df.iloc[:, -1]     # 맨 마지막 칼럼 데이터를 의미함
data_df.iloc[:, :-1]    # 맨 마지막 칼럼을 제외한 모든 데이터
#loc[ ] 연산자
DataFrame.loc[인덱스 값, 칼럼명] _ 명칭 기반
명칭 기반이므로 인덱스와 칼럼명이 들어가게 된다.
그렇기 때문에 일반적으로 start stop+1으로 인식하고 있던 구조가 아닌 start stop 구조로 인식해야 한다.
#불린 인덱싱
불린 인덱싱은 [ ], loc[ ]에서 지원된다. iloc[ ]의 경우, 위치 기반이기 때문에 boolean 값을 지원하지 않는다.
굉장히 다양한 조건을 설정할 수 있고, 여러 개의 조건을 & 을 통해 연결할 수 있으므로 많은 경우 사용된다.
5. 정렬, Aggregation 함수, GroupBy 적용
DataFrame과 Series의 정렬을 위해서는 sort_values를 사용한다.
sort_values(by=[column 명], ascending = T/F, inplace = T/F)
*by 는 어떤 column을 기준으로 sorting 할 것인지 결정하는 parameter이고,
ascending 은 오름차순/내림차순을 선택하는 parameter이다.
inplace 는 앞선 바와 같이 정렬 결과를 원본에 적용이 되는지를 결정하는 옵션이다.
titanic_sorted = titanic_df.sort_values(by=['Pclass', 'Name'], ascending=False)
print(titanic_sorted.head(3), '\n')

print((titanic_df.sort_values(by=['Pclass'], ascending=False)).head(3), '\n')
print((titanic_df.sort_values(by=['Name'], ascending=False)).head(3), '\n')
Aggregation 함수는 min( ), max( ), sum( ), count( ), mean( ) 과 같은 함수를 말한다.
특정한 칼럼만을 추출해서 적용할 수도 있다.
titanic_df.count()


titanic_df[['Age', 'Fare']].mean()
groupby( ) 는 DataFrame 속 특정 칼럼을 index로 만든 또다른 형태의 DataFrame을 반환한다.
titanic_groupby = titanic_df.groupby(by='Pclass')
print(type(titanic_groupby))

titanic_groupby = titanic_df.groupby('Pclass').count()
titanic_groupby


titanic_groupby2 = titanic_df.groupby('Pclass')[['PassengerId', 'Survived']].count()
titanic_grgoupby2

titanic_groupby2 = titanic_df.groupby('Pclass')['Age'].agg([max, min])


agg_format={'Age':'max', 'SibSp':'sum', 'Fare':'mean'}
titanic_df.groupby('Pclass').agg(agg_format)
6. 결손 데이터 처리
머신러닝 알고리즘은 NaN 값을 처리하지 않으므로 이 값을 다른 값으로 대체해야 한다.
이 NaN 값은 aggregation 함수 연산 시 제외가 된다.
NaN 여부를 확인하는 API는 isna( ) & NaN 값을 다른 값으로 대체하는 API는 fillna( ) 이다.
titanic_df.isna().sum()


titanic_df['Cabin'] = titanic_df['Cabin'].fillna('C000')
titanic_df.head(3)

titanic_df['Cabin'] = titanic_df['Cabin'].fillna('C000')
titanic_df.head(3)

titanic_df['Cabin'].fillna('C1000', inplace=True)
titanic_df.head(3)


titanic_df['Age'] = titanic_df['Age'].fillna(titanic_df['Age'].mean())
titanic_df['Embarked'] = titanic_df['Embarked'].fillna('S')
titanic_df.isna().sum()
7. apply lambda 식으로 데이터 가공
def get_square(a):
	return a**2


print('3의 제곱은 : ', get_square(3))


lambda_square = lambda x : x**2
print('3의 제곱은 : ', lambda_square(3))


a=[1, 2, 3]
squares = map(lambda x:x**2, a)
list(squares)
함수명과 입력 인자를 먼저 선언하고 함수 내에서 입력 인자를 가공한 뒤 결과값을 return과 같은 문법으로 반환한다.
lambda는 이런 함수의 선언과 함수 내 처리를 한 줄의 식으로 변환한다.
lambda 식을 이용할 때 여러 개의 값을 입력 인자로 사용해야 할 경우 map( ) 함수를 결합해 사용한다.
titanic_df['Name_len'] = titanic_df['Name'].apply(lambda x : len(x))
titanic_df['Name', 'Name_len'].head(3)


titanic_df['Child_Adult'] = titanic_df['Age'].apply(lambda x : 'Child' if x <= 15 else 'Adult')
titanic_df[['Age', 'Child_Adult']].head(8)
ㅇ
'Self-Taught > Machine Learning' 카테고리의 다른 글
| 파이썬 머신러닝 완벽 가이드 _ CH.4.1~4.6 (1) | 2024.11.02 |
|---|---|
| 파이썬 머신 러닝 완벽 가이드 _ CH.3 (2) | 2024.10.12 |
| 파이썬 머신러닝 완벽가이드 _ CH.2_(1) (1) | 2024.10.05 |
| 파이썬 머신러닝 완벽 가이드 _ CH.1_(2) (1) | 2024.09.28 |
| 파이썬 머신러닝 완벽 가이드 _ CH.1_(1) (1) | 2024.09.28 |


